Most people use Solana block explorers to view and analyze transactions, allowing them to see what’s happening on-chain. Wallets and DeFi applications integrate with block explorers to let their users confirm transaction status, view transaction histories, and better understand what’s happening on-chain. To look up a Solana transaction on Orb, simply copy your transaction signature from your wallet or app’s UI and paste it into Orb’s search bar. Let’s look at a typical token swap. In this example, USDC is swapped for ORE through Jupiter.Documentation Index
Fetch the complete documentation index at: https://helius-add-sendbundle-api-docs.mintlify.app/llms.txt
Use this file to discover all available pages before exploring further.
AI Overview and Summary
If all you need is basic transaction information, read the summary or click the “Explain with AI” button to get a high-level overview of what happened in this transaction. For example, clicking the Explain with AI button shows that this transaction involved swapping $83,188 $USDC for 546.97 $ORE using the Jupiter Aggregator v6 program.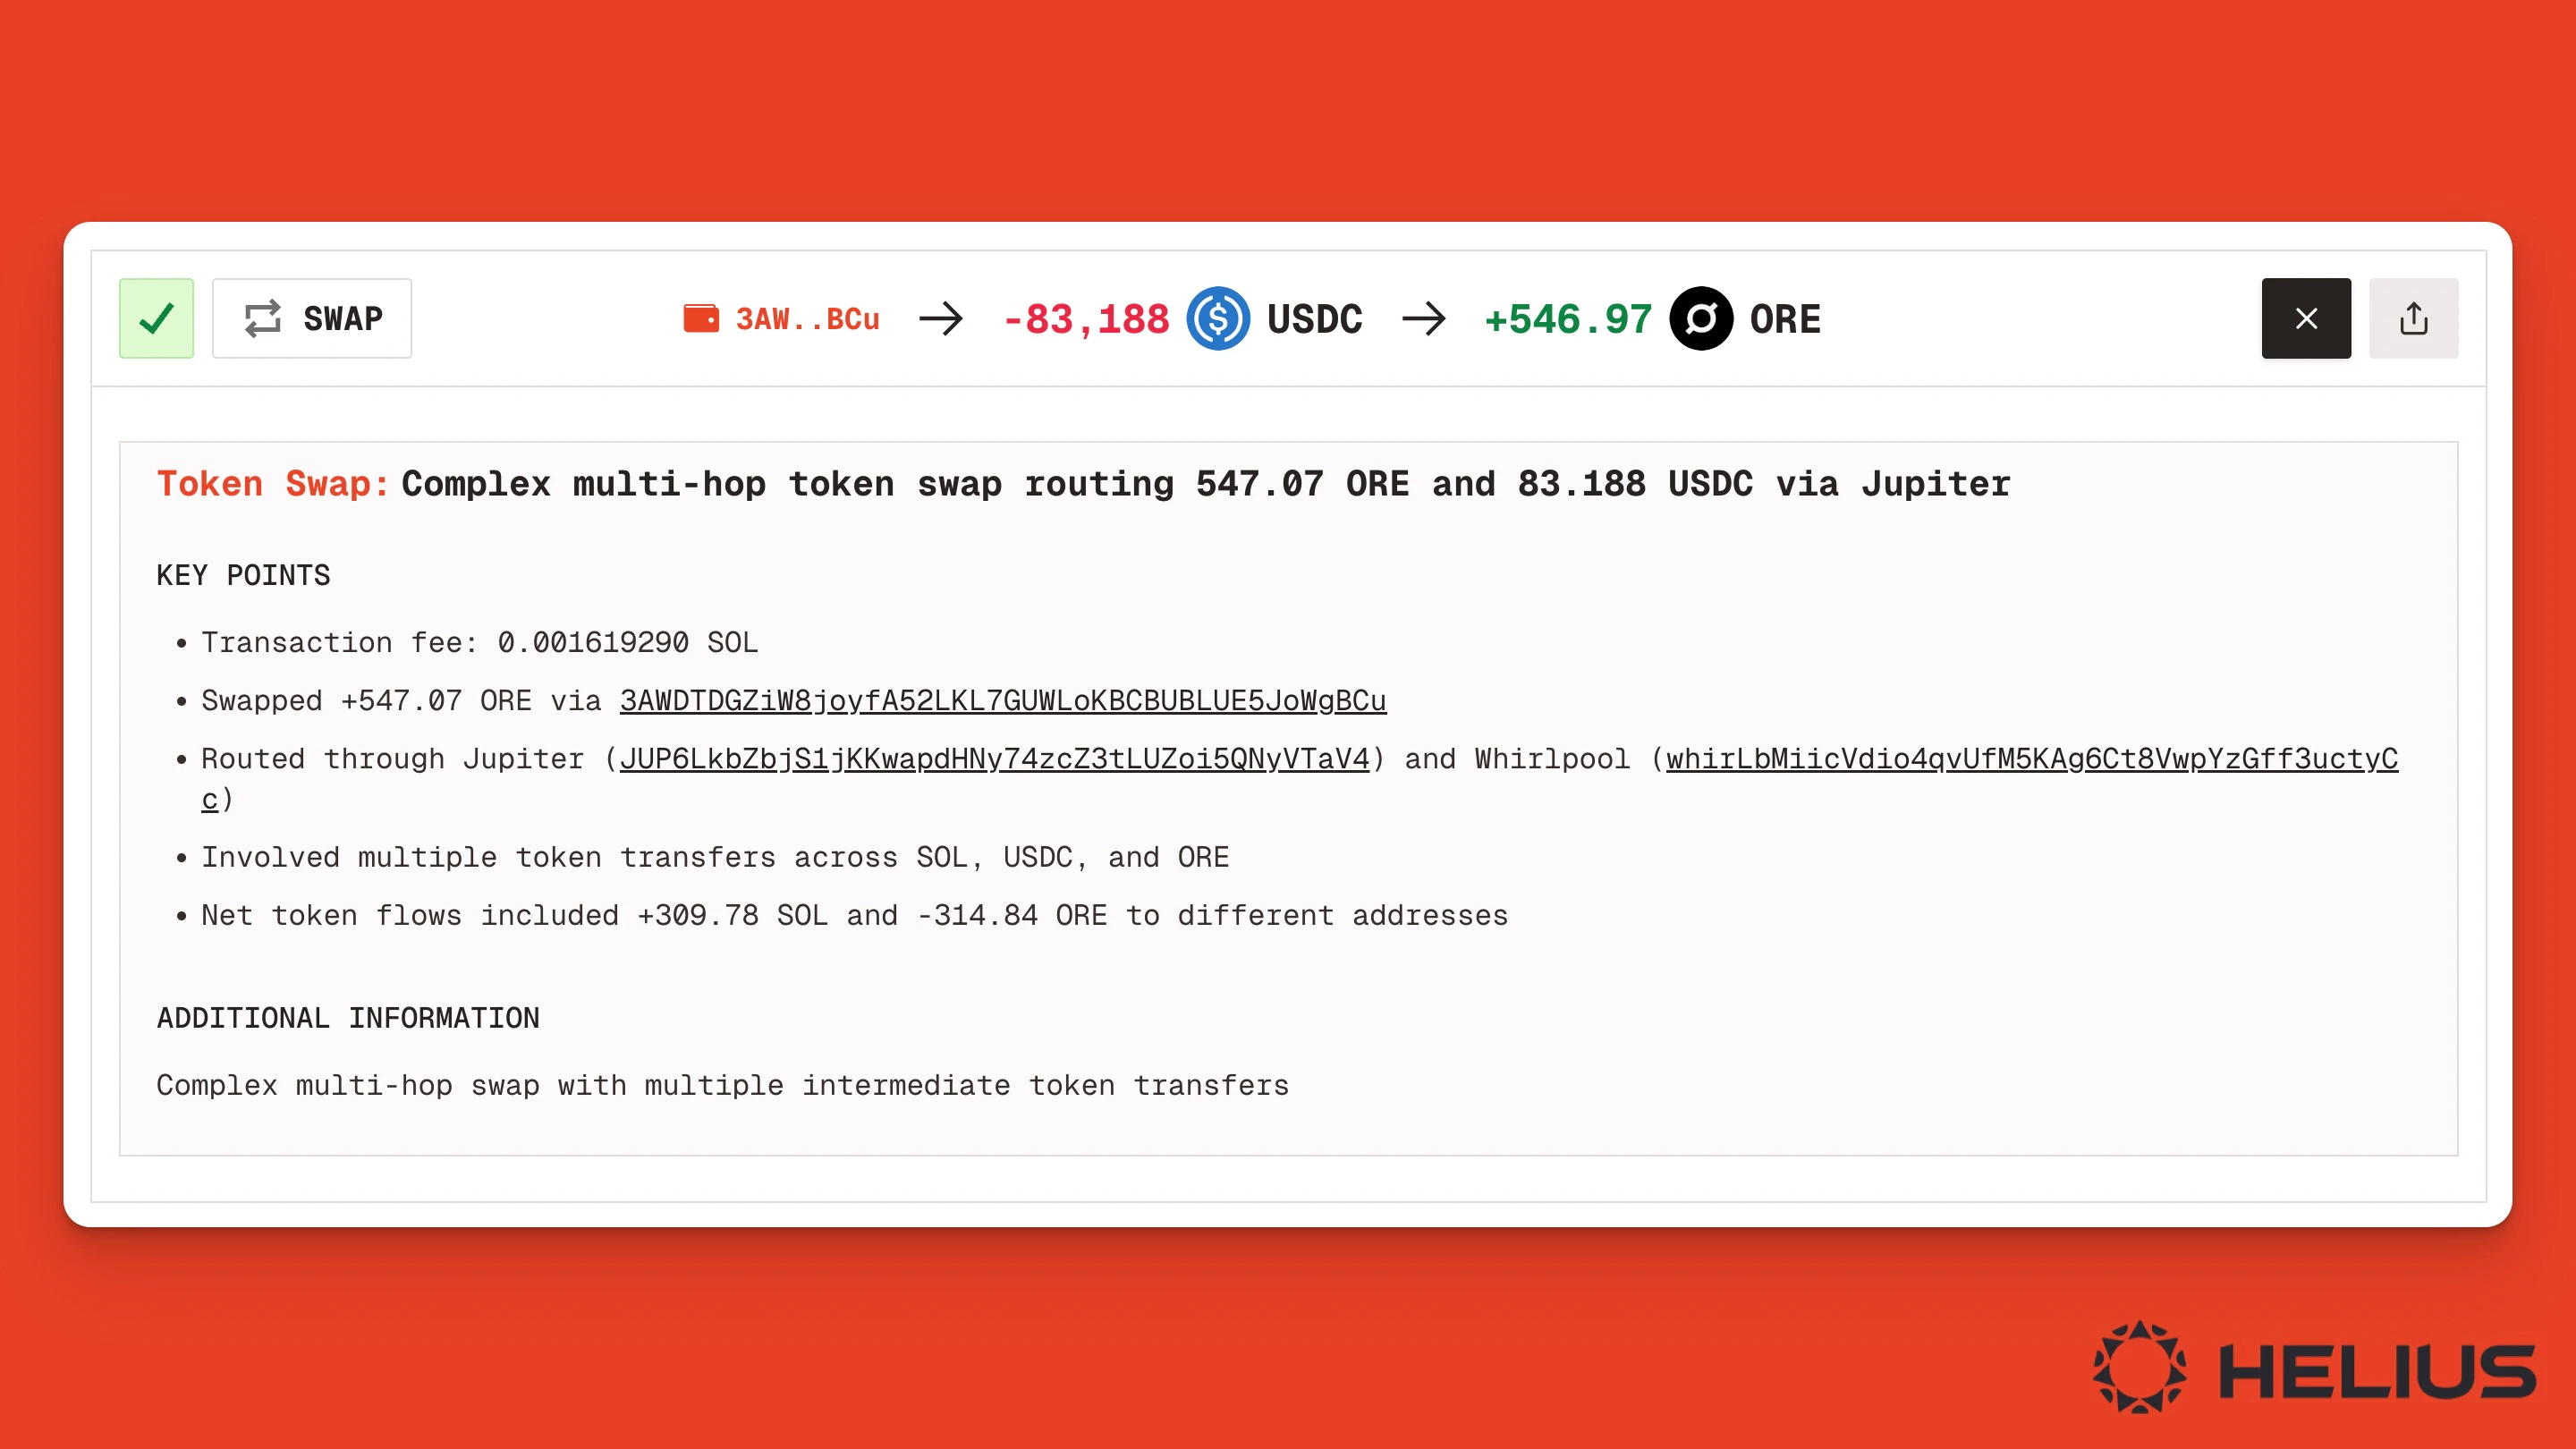
Instruction Summary and Details
Scrolling down the page, the Instruction Summary shows all intermediate steps, such as transferring $USDC from the owner’s wallet to the Jupiter Aggregator Authority account.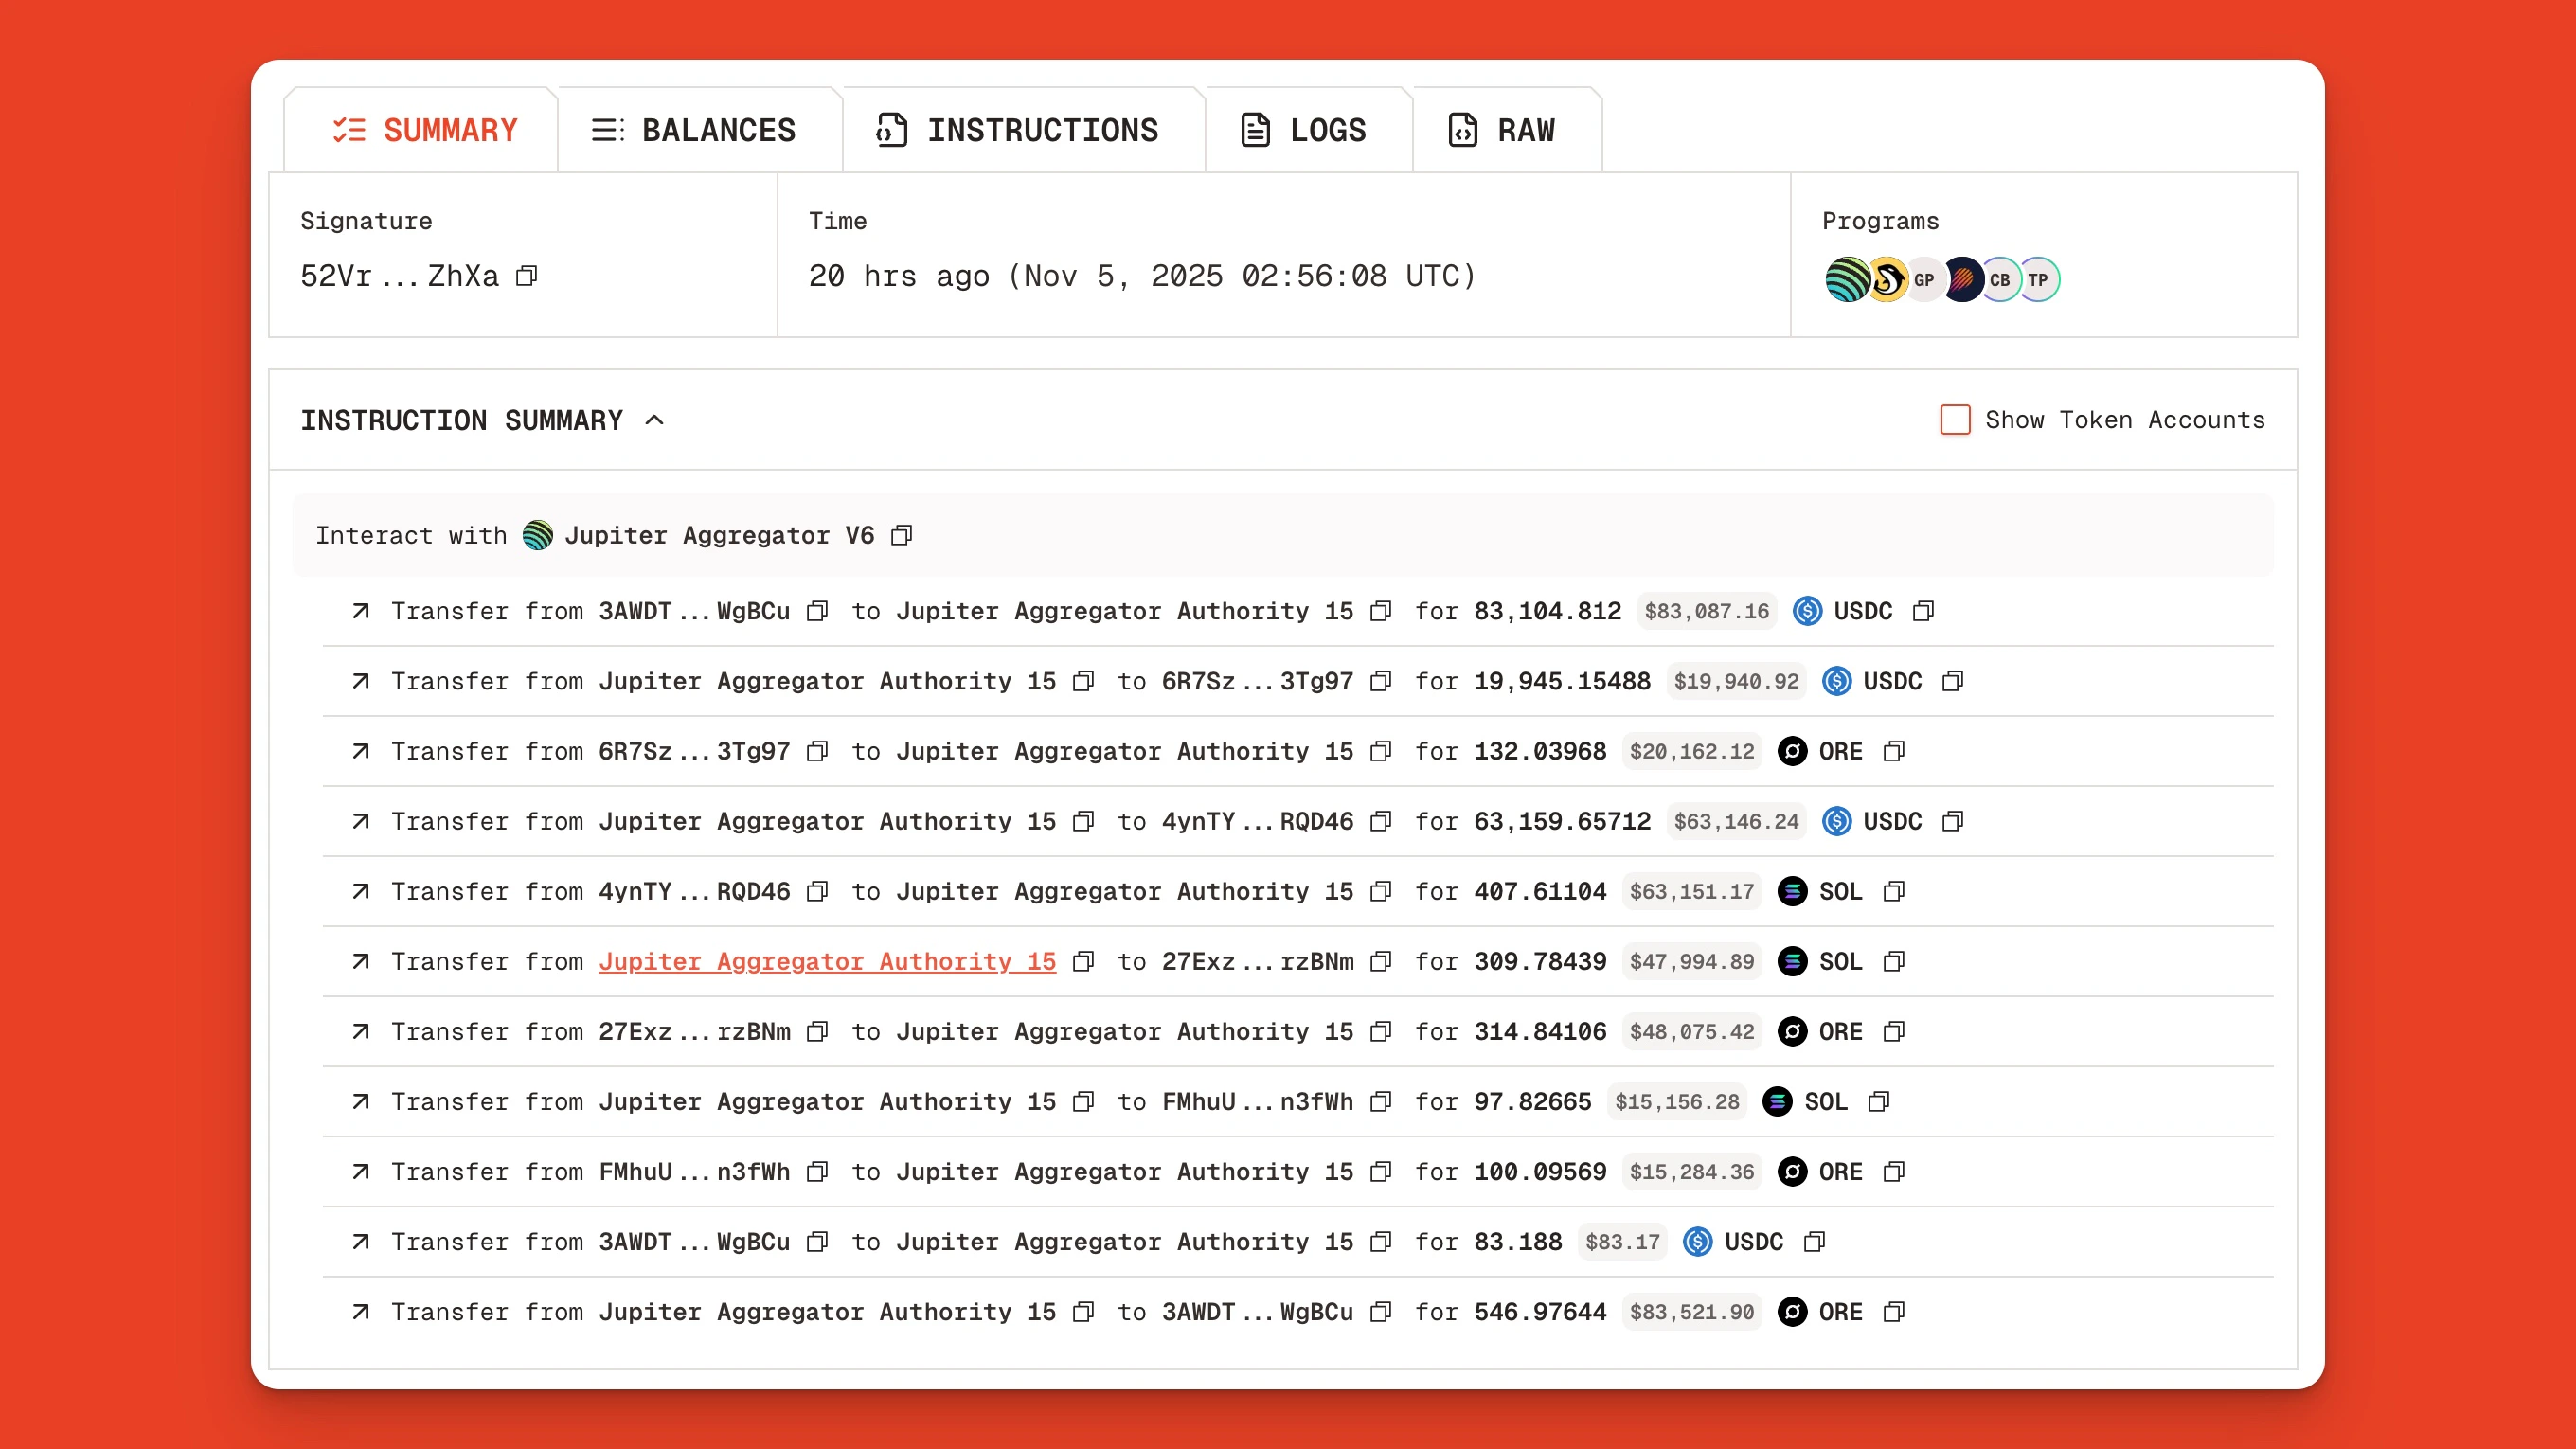
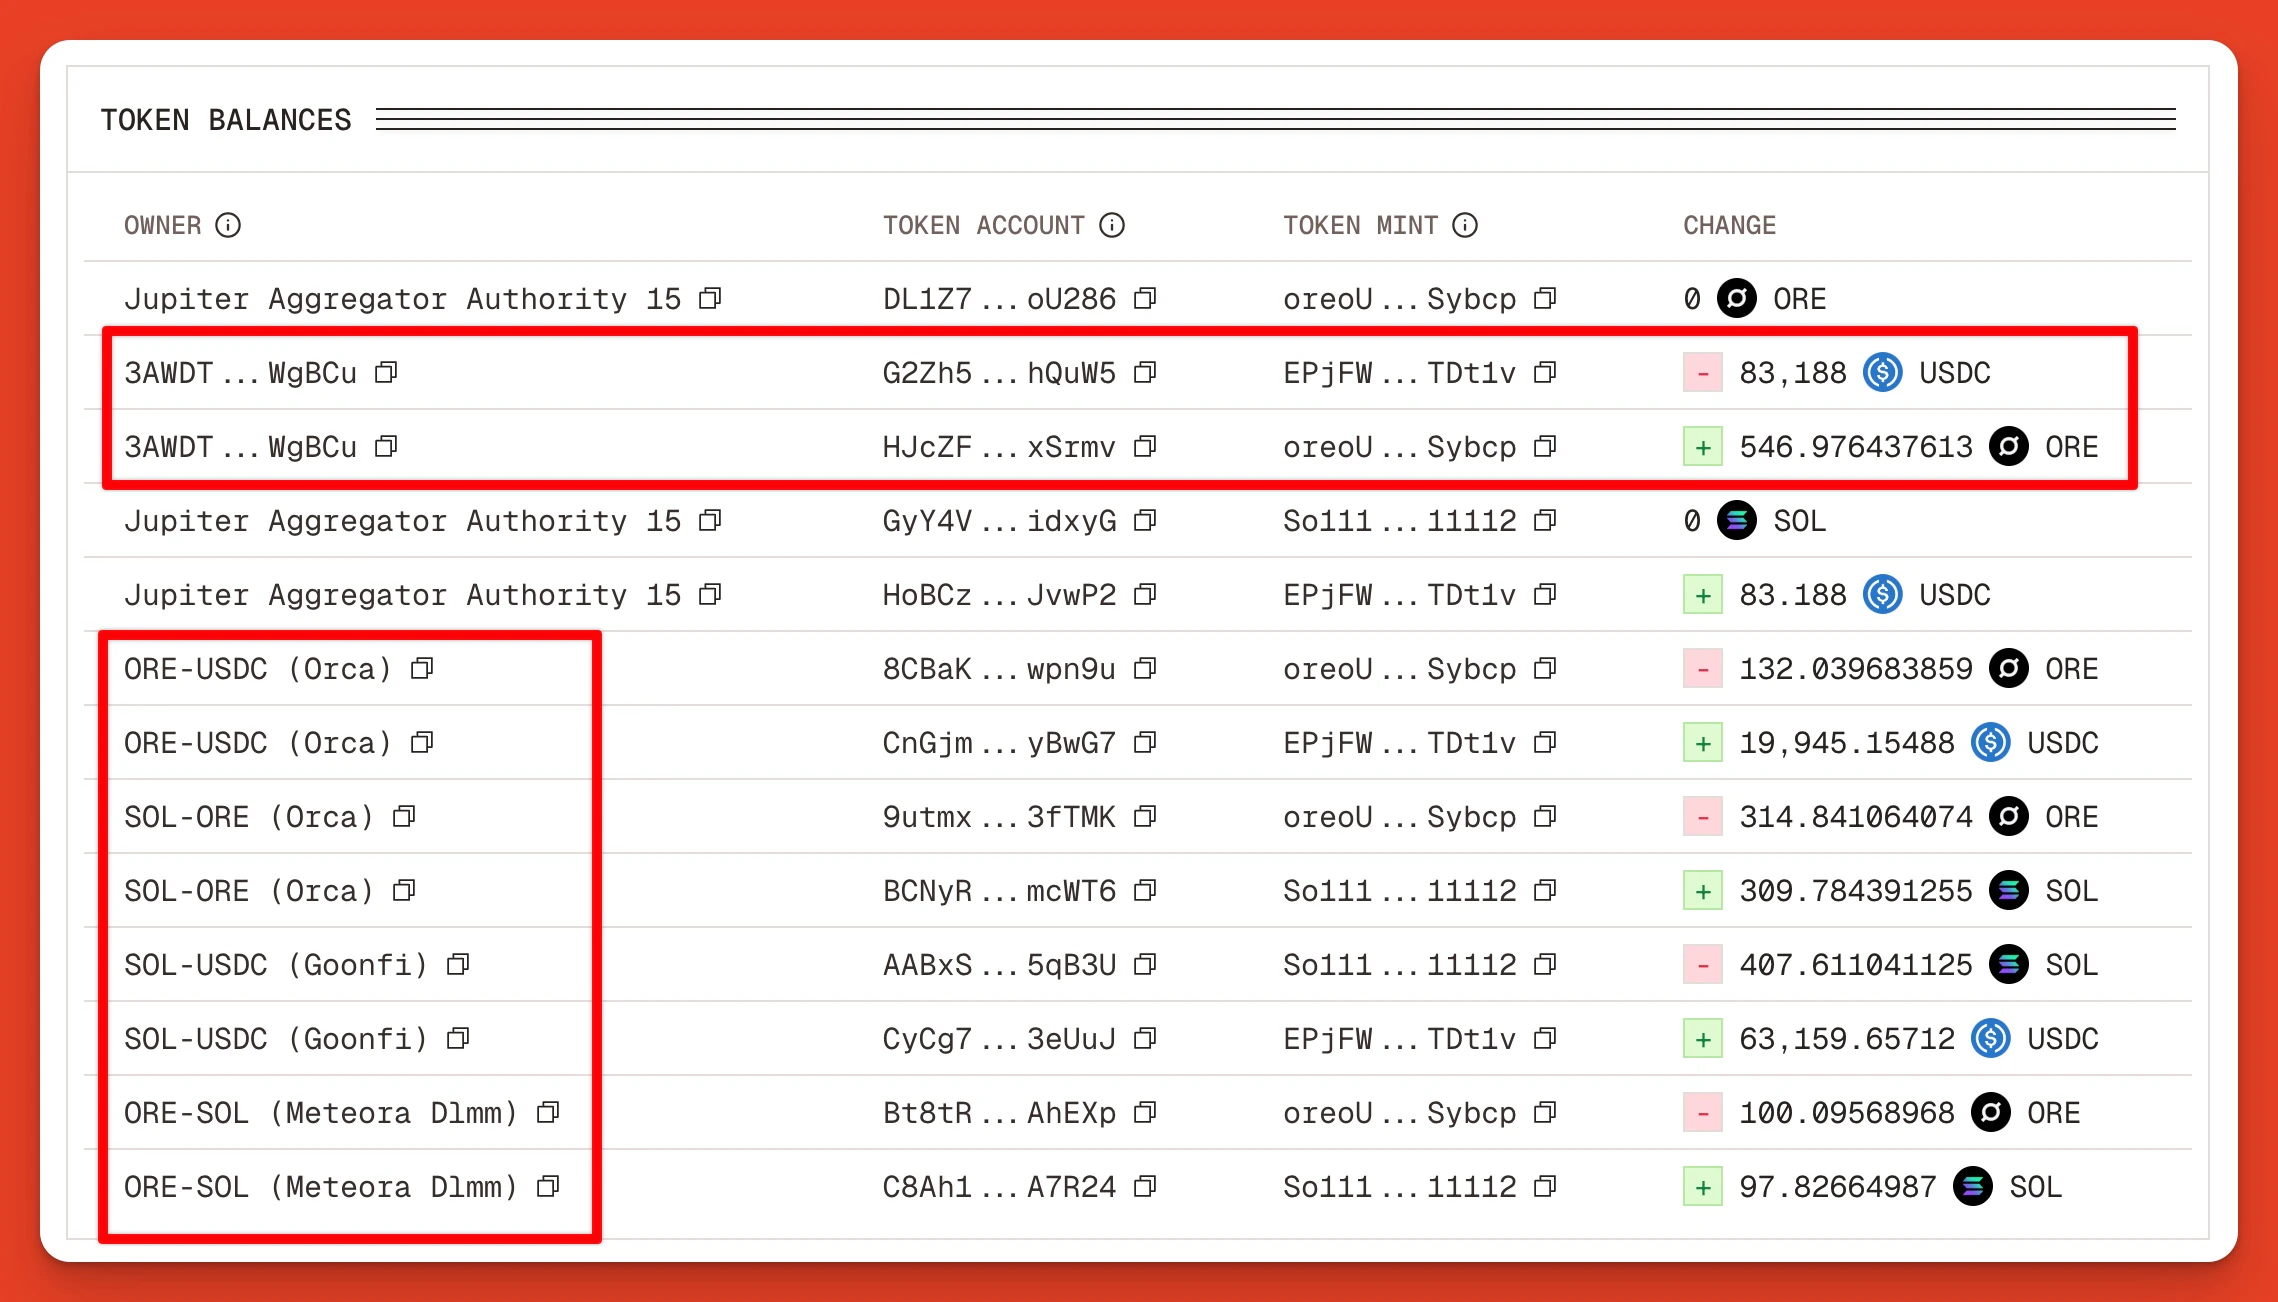
Transaction Balances
Clicking into the Balances tab, we can see a clear summary of the token balance changes for each address and market. We see the original wallet3AWDT…WgBCu is swapping USDC for ORE across multiple markets, including Orca, Goonfi, and Meteora DLMM, which processed parts of the trade.
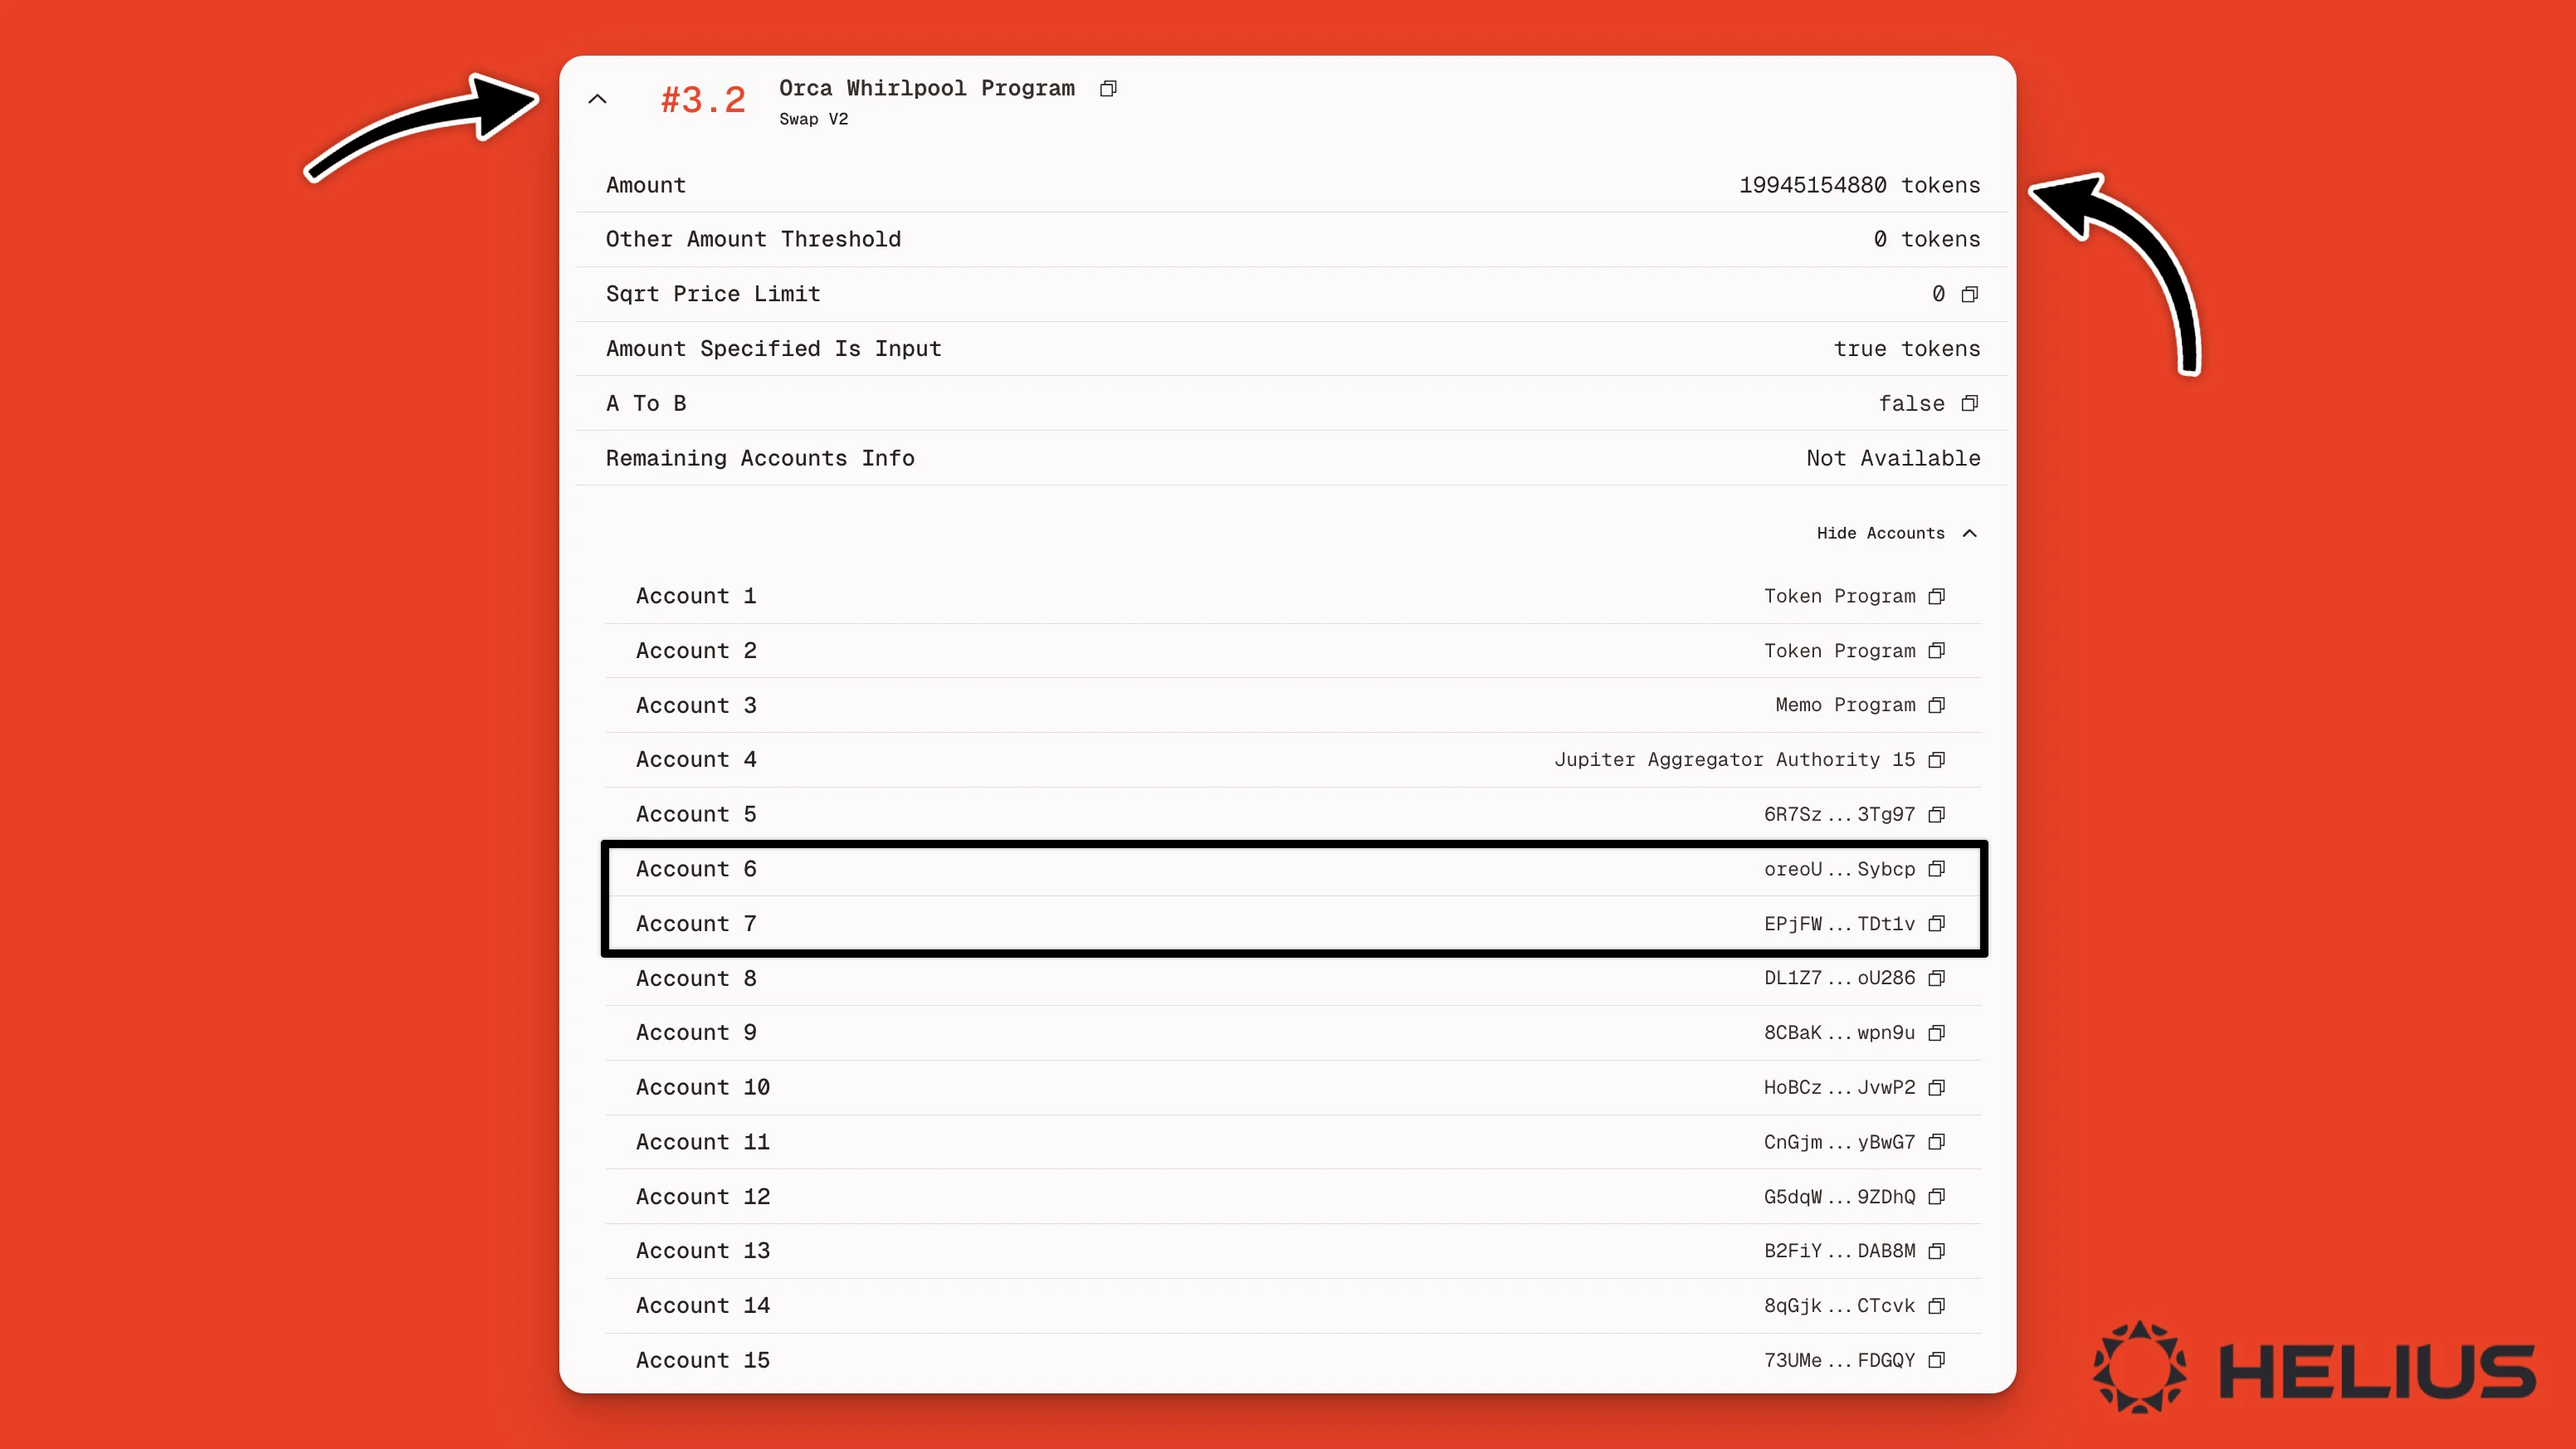
Transaction Instructions
Clicking into the Instructions tab, we can see that the transaction included calling the Compute Budget Program and the Jupiter Aggregator v6 program. Expanding the Jupiter program, we see 15+ inner instructions, including invoking Solana’s token program, Orca’s Whirlpool Program, Meteora’s DLMM Program, and the GoonFi program (a Solana Prop AMM).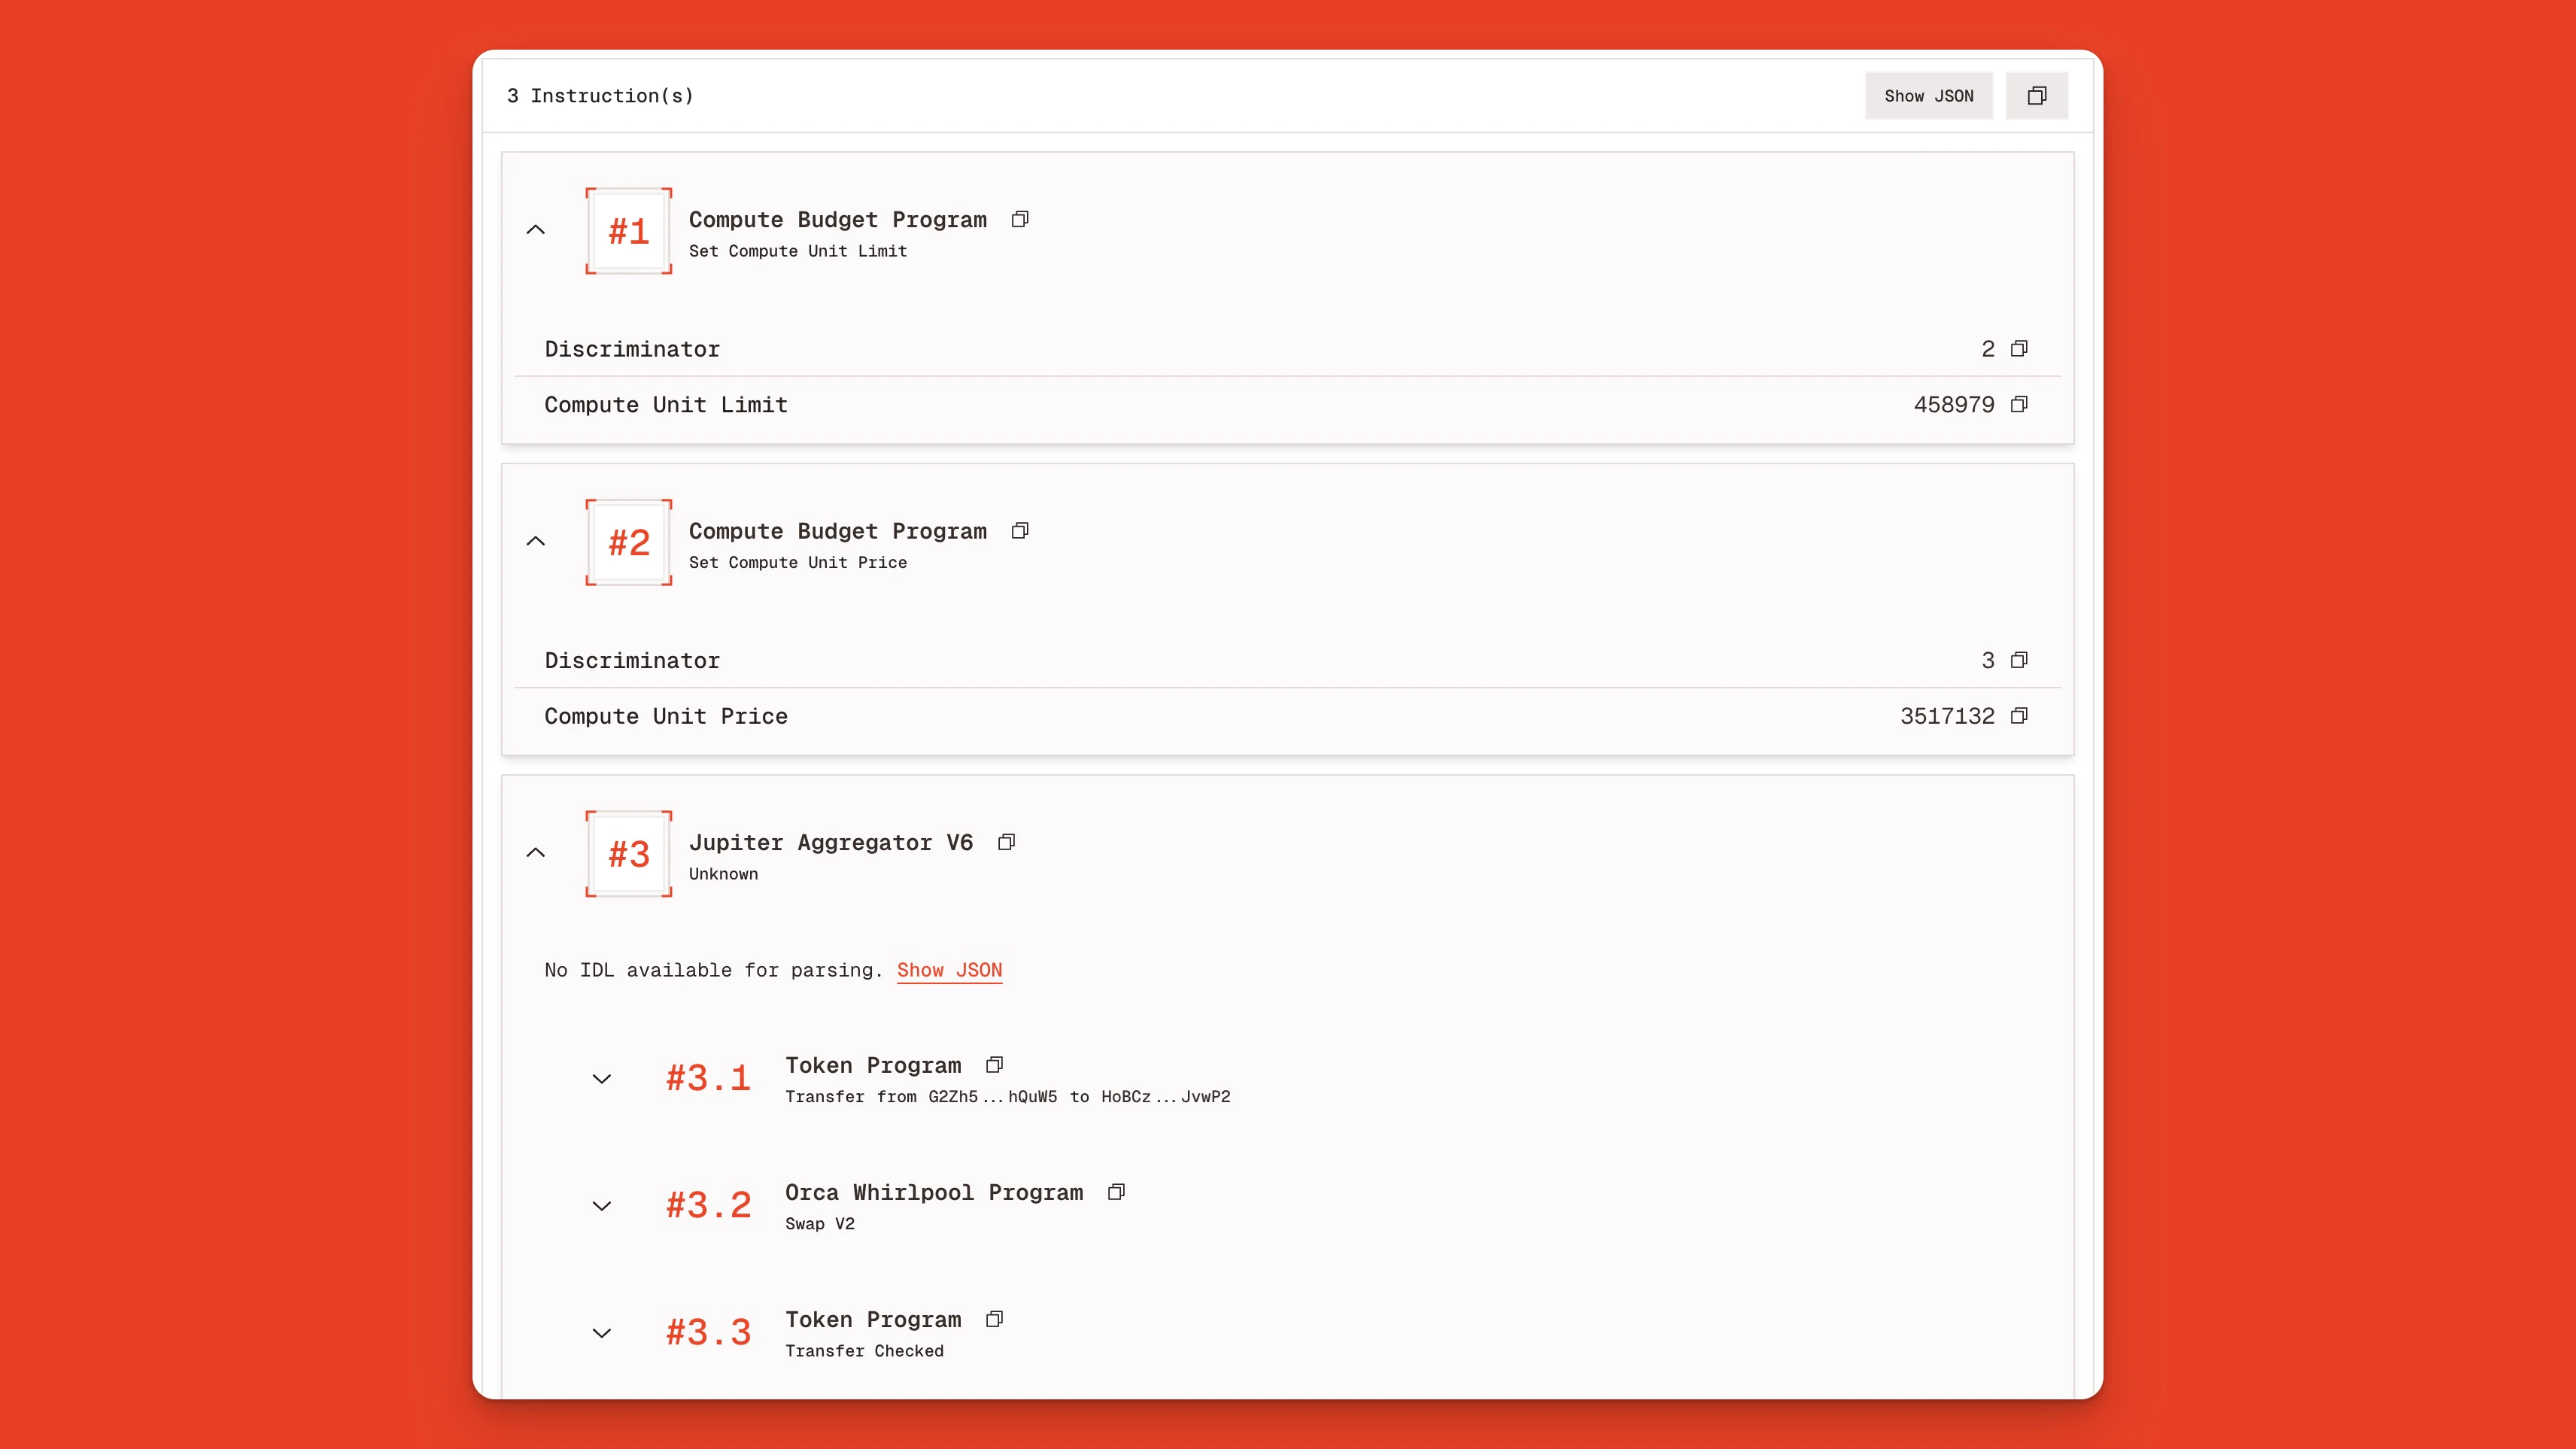
Transaction Instruction Logs
To inspect the transaction logs, click the Logs tab. Here we can view the logs emitted by each program, which typically display the name of the called instruction, the status (i.e., success/failure), and the number of compute units consumed.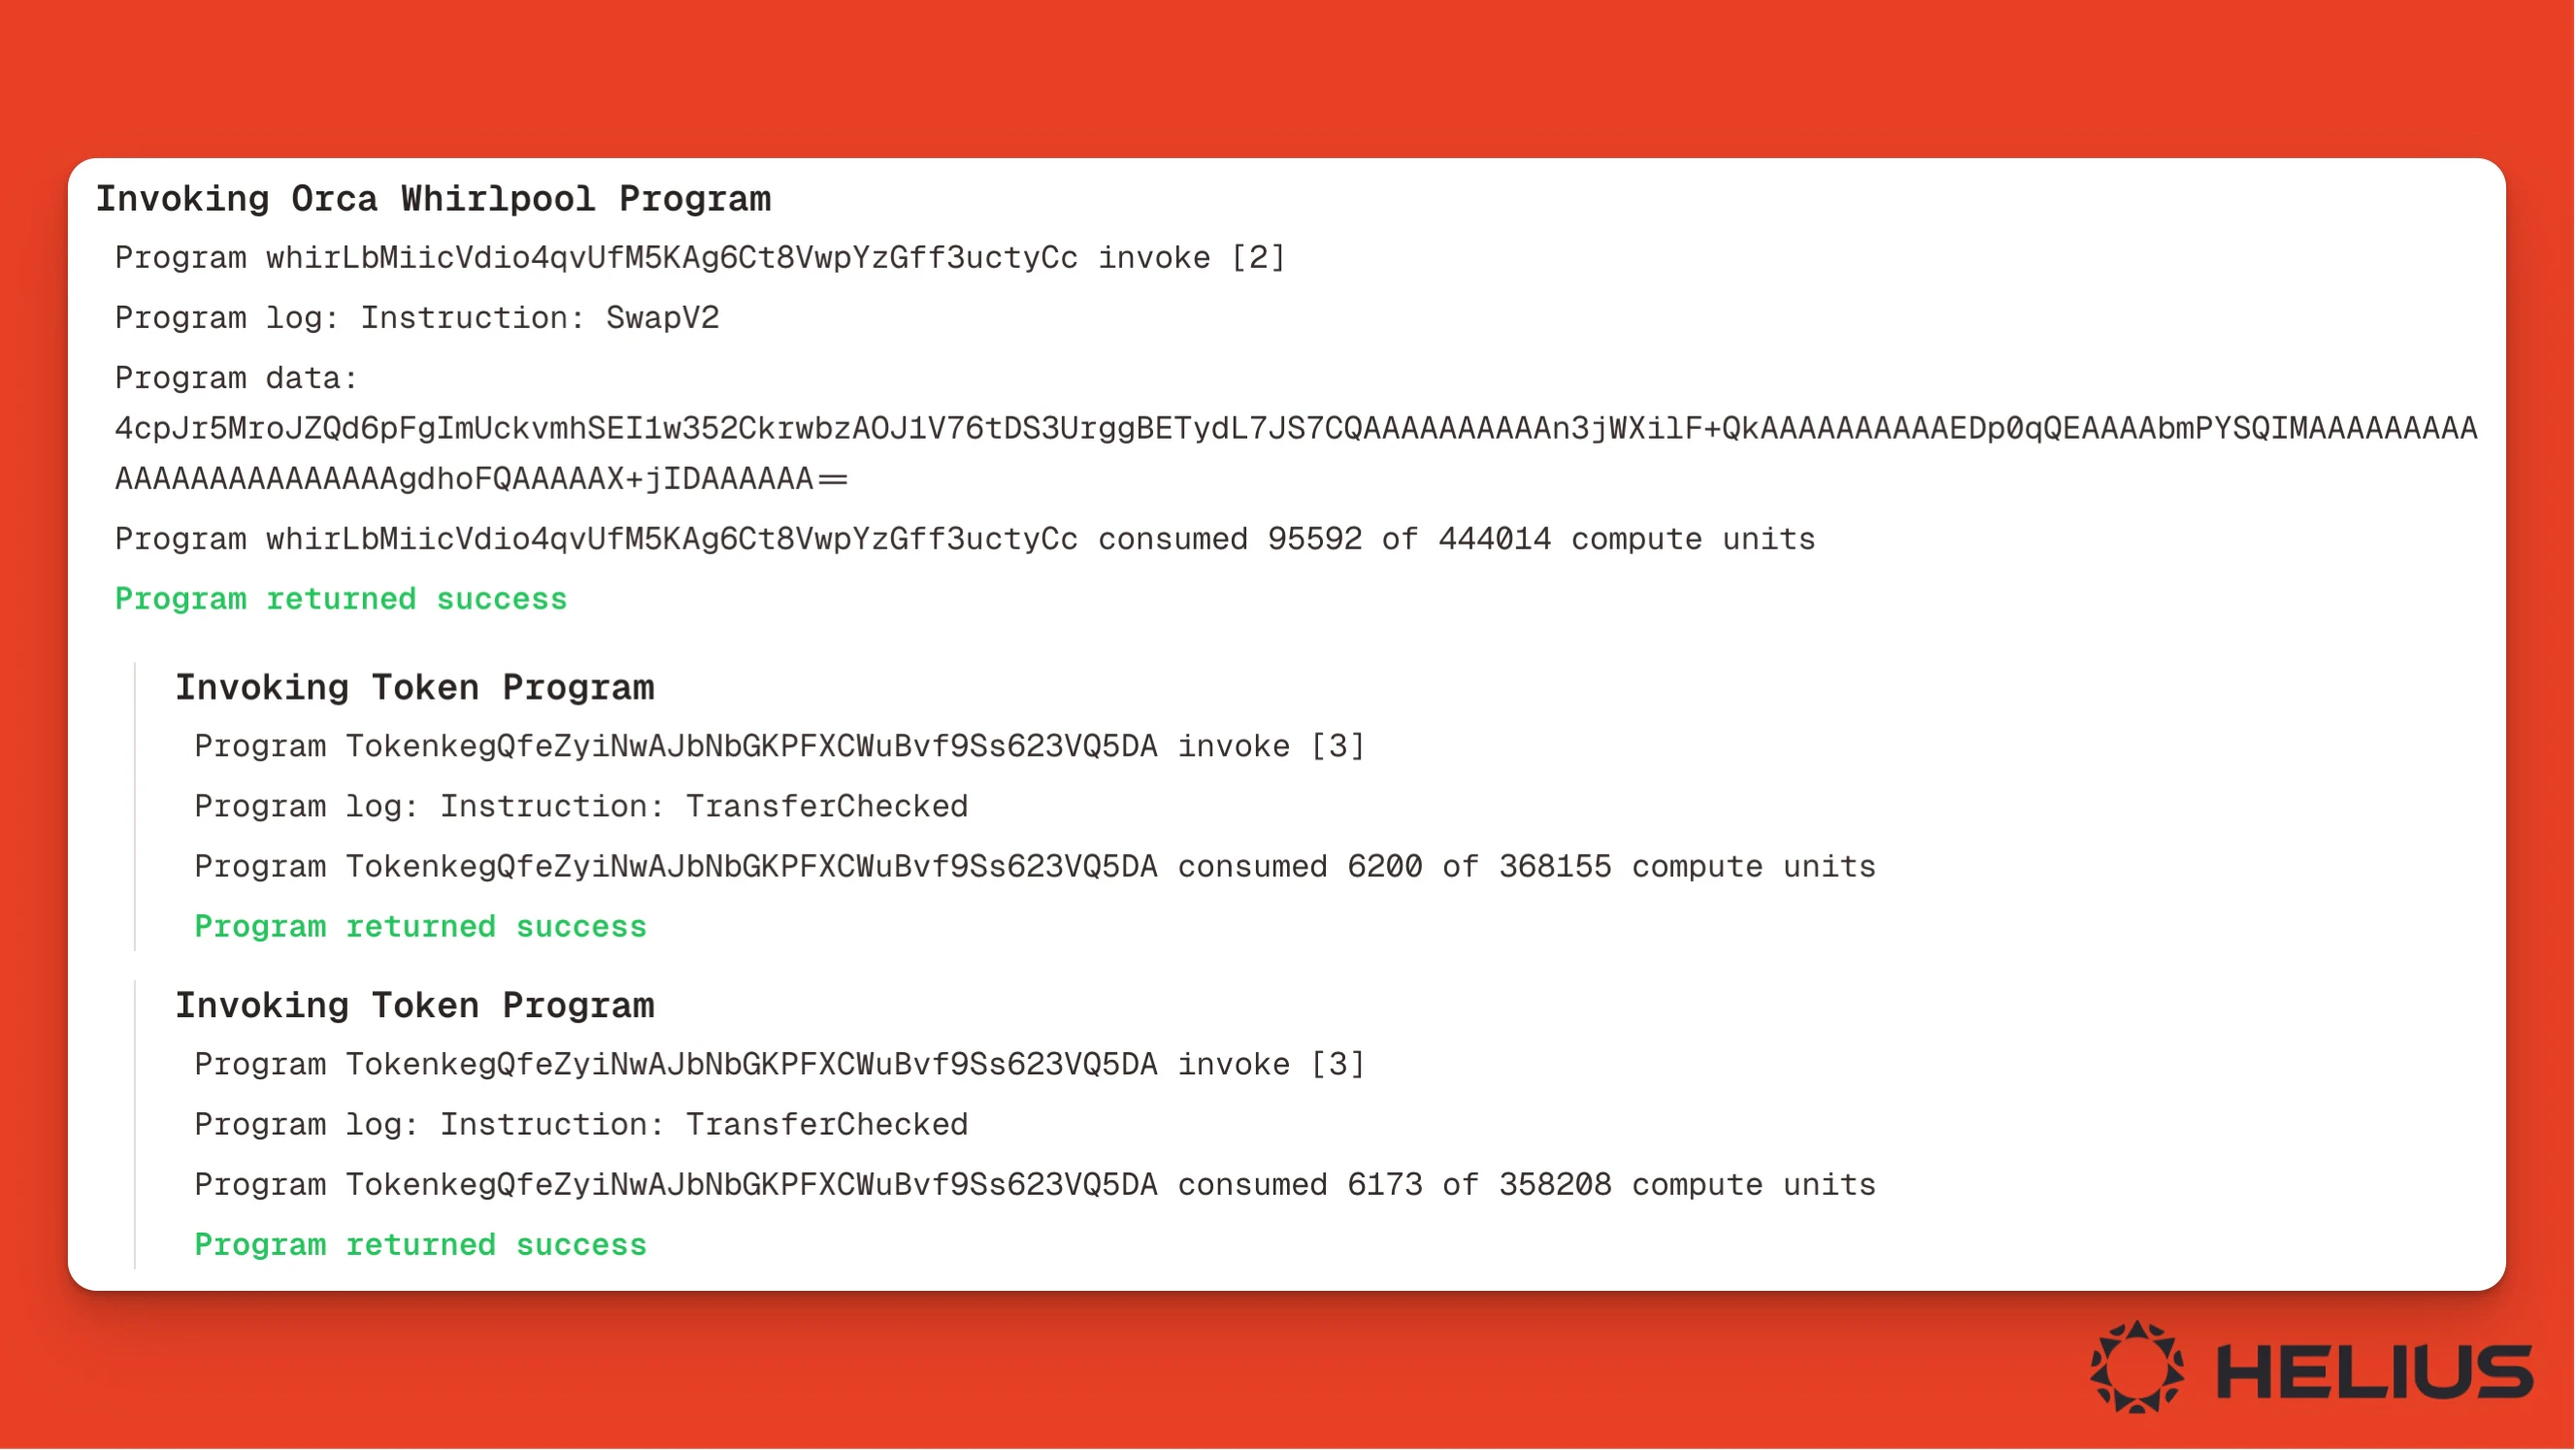
Raw Transaction JSON
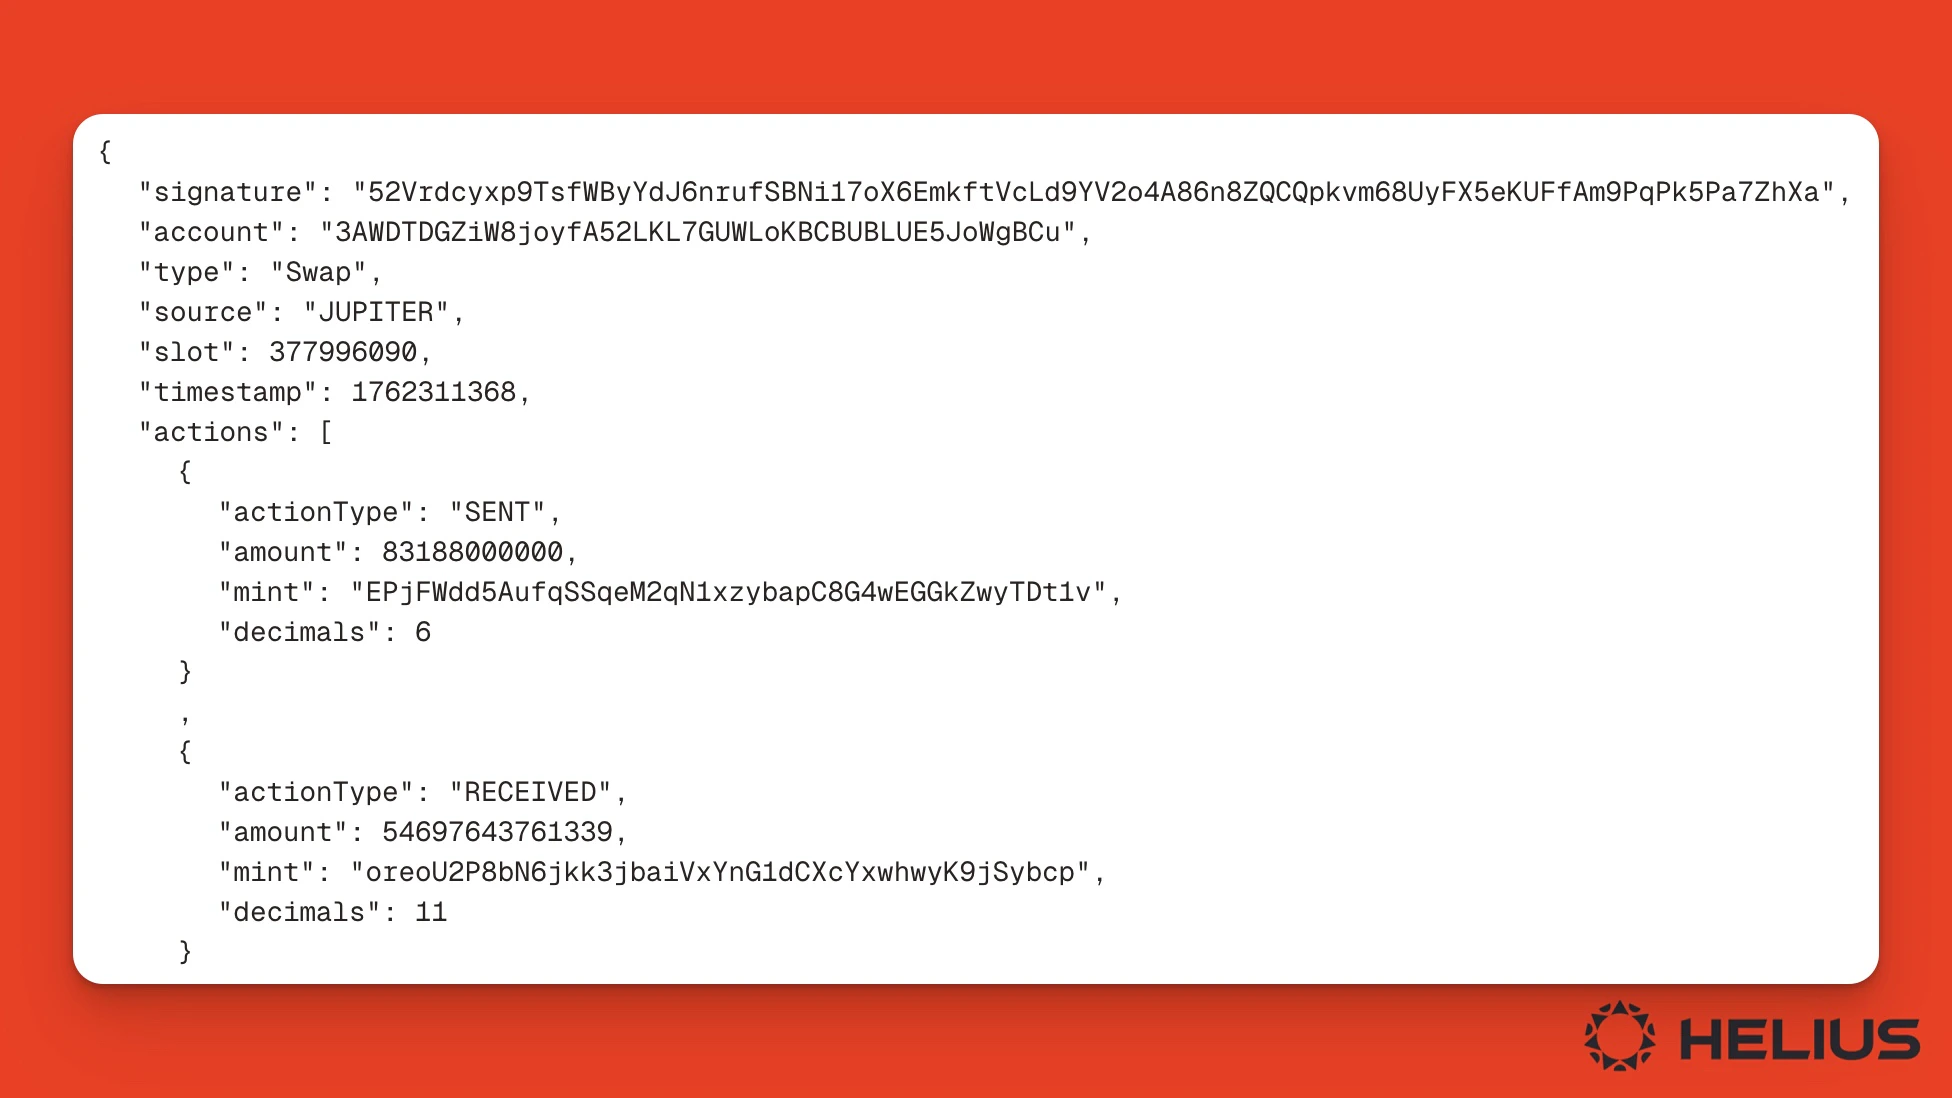
For the most granular output, click the Raw tab. Here, you can see each instruction either as raw JSON output, which can be made more human-readable by enabling the “Helius Enhanced” toggle.